
Shipping Survey: Methodology and Tools
Commas, smushed ship names, and one long-suffering data professional.


To accompany the Tableau visualization of my analysis of the Fansplaining Shipping Survey data, I’m providing a quick write-up of my methods so that you can better understand the limitations of my analysis and how some of the data, particularly the ships data, was cleaned. The raw data is available to anyone to play with and check out.
I wasn’t involved with the survey design, but after the survey kicked off, I offered to analyze and create visualizations for the quantitative data. Quantitative data analysis, including survey data, is part of my job; I was excited to get to play with fun data for once.
For people who may be new to reading about data structure, relational databases, or data manipulation, here’s a quick glossary to help you understand the write-up. Data nerds can skip ahead.
Tables 101
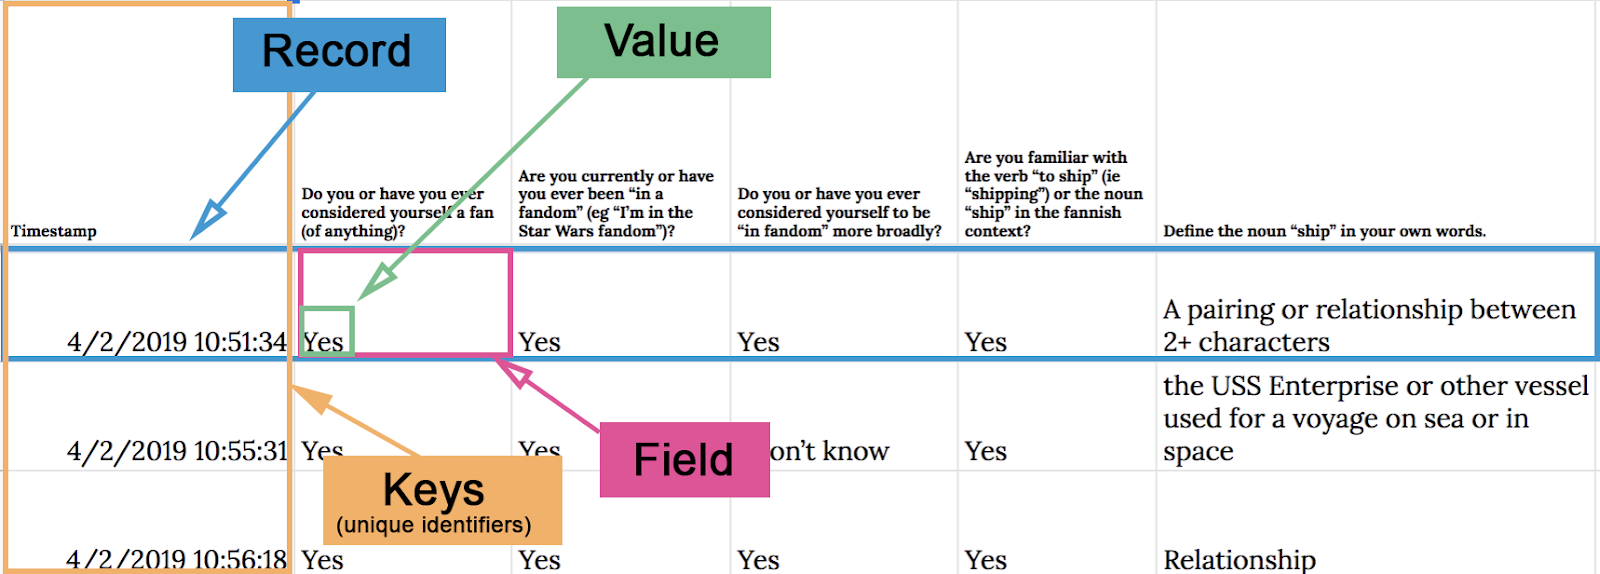
- table. Each form entry passed into a Google Sheet, creating a table of responses. Each survey response became a row in that sheet, with each question becoming a column.
- record. When describing a survey response, I will refer to it as a record unless I’m making a row/column distinction.
- field. Each unique answer to survey question represents a field in the record. You can visualize this as a cell inside a table.
- value. Values are stored inside fields.
- key. A key is unique identifying value in a record; in this data, timestamps were the primary key.
- csv. A CSV is a text file that stores data as comma-separated values. Commas played an important role in how I analyzed most of this data.
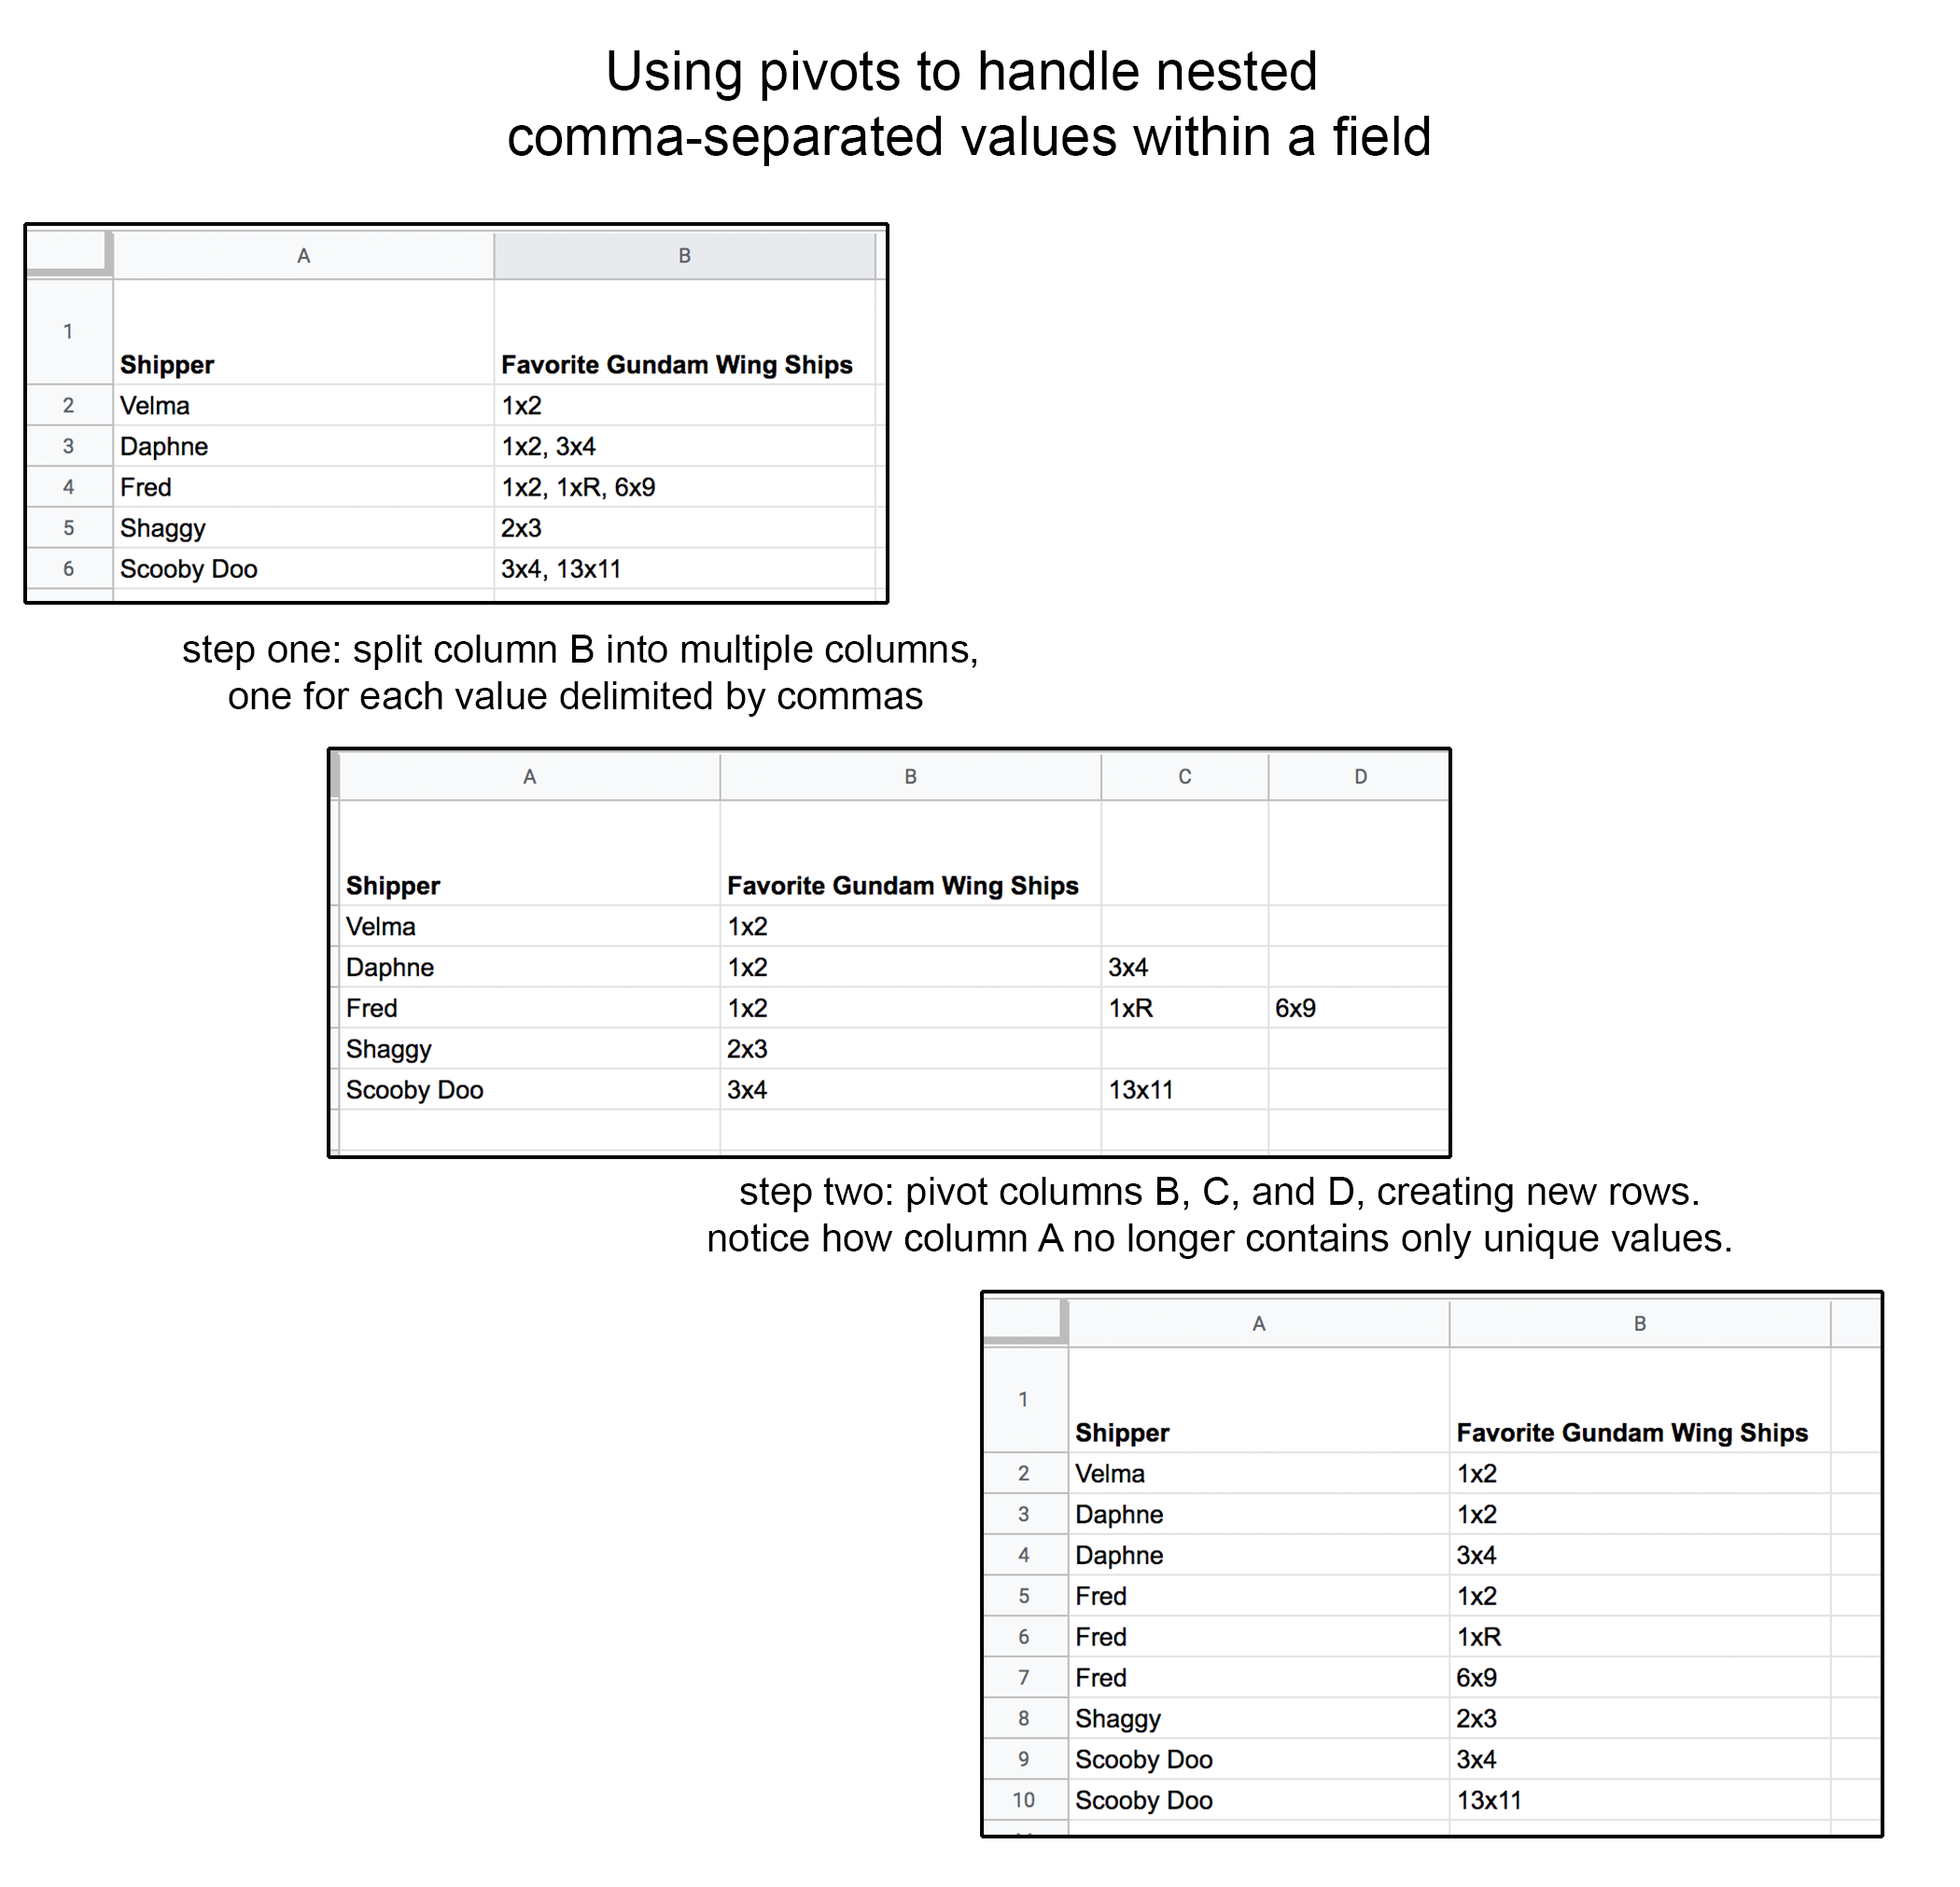
- pivot. To pivot is to transpose rows and columns in a data set. Above is an example of how pivots were used to analyze the nested comma-separated values generated by checkbox questions on the survey.
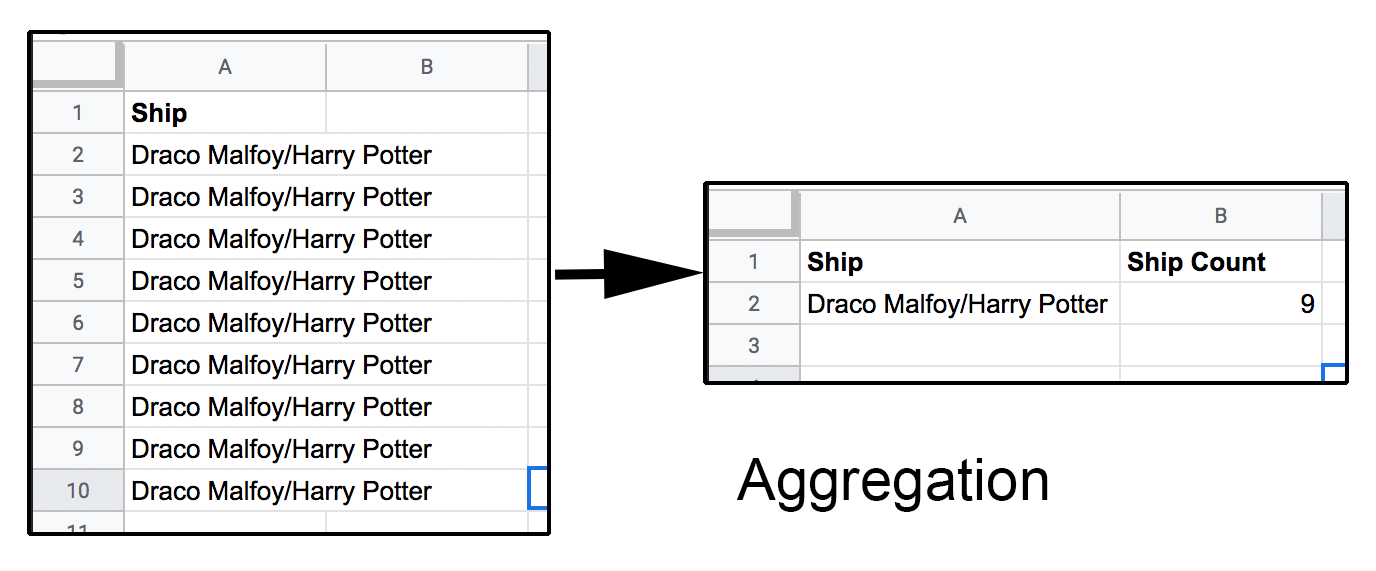
- aggregation. Aggregation takes a column and outputs a single record for each values and, in a separate column, the count of times that value appeared. (You can also aggregate multiple columns to do things like sum the numerical values in one column grouped by values that appear in another column.)
- narrow/wide. “width” of a data set refers to the number of columns present. A data set is said to be “wide” if it contains many columns and “narrow” if it contains few.
The Tools
I used Tableau Desktop to analyze the data and create interactive visualizations, Tableau Prep for data cleaning, Microsoft Excel for some row-level data cleaning, and Google Sheets as a collaboration tool for decoding and cleaning ship names (more on that below).
Performance
To optimize performance of the final visualization, I used aggregation on separate, narrow tables in almost all cases where checkbox questions required pivoting. (Otherwise, this data set would have millions of rows.) I aggregated using the distinct count of timestamps to determine the number of responses. Charts labeled “no filtering” are generally pulling from aggregated data; filtering on radio button questions would require the original timestamps to use as the key.
The Questions
There were three types of questions in the Fansplaining Shipping Survey:
- radio buttons (only one answer can be selected)
- check boxes (multiple answers can be selected)
- free response (text entry)
Radio Button Questions
These were straightforward and required no additional cleaning from me.
Checkbox Questions
Each checkbox question required pivoting. One question (I’m looking at you, “When you say you’re shipping something, what does that mean you personally are doing?”) had 12 possible values in addition to a free response option. In all cases, I chose to work with as few columns as possible to optimize performance both for data cleaning and the final viz. With the exception of the current and past ships data, I also dropped all text responses to leave to Flourish and Kate for qualitative analysis. When I analyzed the responses to this question, I aggregated on the 12 checkbox values and dropped answers with counts under 10.
Shipping Fandoms
As people were not given restrictions on how to fill out the free-entry text box, the resulting data was, to put it lightly, a mess. I decided that the best place to start was by sampling from the population of people who entered their ships as a comma-separated lists and looking at their top nine ships. (A perfect, unbiased sample? No. However, we have no reason to believe that there is any demographic or fandom influence on how people fill out a text-entry field.) This allowed me to split each column of answers into multiple columns, using commas to show where to split. The cleaned columns that would eventually come out of this are labeled “Overall Current Ships” and “Overall Past Ships.”
Next, I used the lists of the highest-ranked overall ships to go through and create “Top Current Ships” and “Top Past Ships,” doing a lot of manual cleaning in my visual data prep tool to find all records that listed these ships or variants thereof first. In addition to getting a more accurate count of the characters people primarily shipped, I also wanted to capture the numerous responses that fell into the category of “one” and “any.”
The biggest difficulty in dealing with the ships data, aside from the general complexity and volume, was people’s use of smushnames. Who are these people? How are we supposed to know? I spent a lot of time googling at first.

Ultimately, I ended up recruiting a number of friends to help identify all the ship names “Overall Current Ships” and “Overall Past Ships,” rewriting the ship name into CHARACTER/CHARACTER format and adding fandom and relationship category information. HEROES.
Work steps for “Overall Current Ships” and “Overall Past Ships”:
- splitting on commas, I split out the first nine values in the “current ships” column into separate columns
- pivoted those columns
- aggregated ship names and dumped any that appeared fewer than 50 times
- manually grouped a lot of ship name variants/smushnames
- aggregated again, summing time stamp count
- repeated with “past ships”
- put this data into a google sheet sheet and crowdsourced help with cleaning up the tags (THANK YOU FRIENDS)
- received edited data!
- then did additional cleaning and swapped in the new ships/fandoms
this data does NOT include people who said “many” or “none,” see #2
Work Steps for “Top Current Ships” and “Top Past Ships”:
- Took “Overall Current Ships” and “Overall Past Ships” to use as a guide
- Using text search, manually grouped ship entries that started with that ship name or known variants, for the top ships in each category (this includes fields beginning with “Destiel” as well as with “I love Destiel”)
- Also manually grouped people who said only “too many” or “so many” and, separately, people who said “n/a” or “none”
- Discovered many people used “same” as an answer for the question about past ships, which came after the current ships question on the form. For those records, joined in responses to the current ships question
- After I’d done about 20-25 ships from each list, I was finding fewer and fewer records At this point, I aggregated on timestamp count and dumped any ship names that appeared fewer than 50 times
Final Thoughts
As is probably clear, I spent most of my time on the ships data—it was a mess and it was also really fun. Many thanks are owed to my friends who helped with the ships data, several coworkers for talking through my workflow and betaing my viz, Flourish and Elizabeth for their enthusiasm and support, and to coggs for the memes.